From January to May, the country's electricity supply and demand overall relaxed. The cumulative growth rate of electricity consumption of the whole society increased year-on-year, and the cumulative electricity consumption of all provinces achieved positive growth. The growth rate of industrial and manufacturing power consumption increased year on year, and the growth rate of electricity consumption fell for three consecutive months. The growth rate of electricity consumption in the high-load energy industry increased year-on-year, and the electricity consumption in the building materials and steel industry increased negatively. The growth rate of installed power generation capacity slowed down, and hydropower generation continued to show negative growth year on year. The utilization hours of power generation equipment decreased slightly, and the utilization hours of water and electricity decreased significantly. Year-on-year growth of electricity delivered across regions and provinces; The scale of new thermal power generation decreased year on year.
I. The cumulative growth rate of electricity consumption of the whole society increased year-on-year, and the cumulative electricity consumption of all provinces achieved positive growth
From January to May, the country's total electricity consumption was 2426.3 billion KWH, up 6.4 percent year on year and 3.6 percentage points higher than the same period last year.
From January to May, the electricity consumption of the primary industry reached 39 billion KWH, up by 6.1% year-on-year, accounting for 1.6% of the total electricity consumption. The electricity consumption of the secondary industry was 1712.9 billion KWH, up by 6.3% year on year and 6.0 percentage points over the same period last year, accounting for 70.6% of the total electricity consumption and 70.3% of the total electricity consumption growth. The electricity consumption of the tertiary industry reached 335.3 billion kilowatt-hours, an increase of 9.0% over the same period last year and 0.6 percentage points lower than that of the same period last year, accounting for 13.8% of the total electricity consumption and 19.0% of the total growth rate. The electricity consumption of urban and rural residents reached 339.2 billion kilowatt-hours, an increase of 4.1% and 4.2 percentage points lower than that of the same period last year. It accounted for 14.0% of the total electricity consumption and contributed 9.1% to the increase.
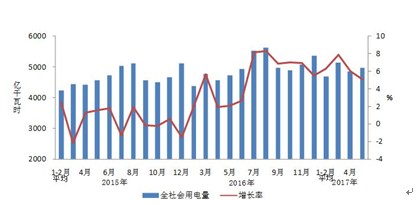 Figure 1: Power consumption and its growth since 2015
Province, 1-5 month, the whole society in various provinces electricity consumption to achieve positive growth, the whole society power consumption growth rate higher than the national average (6.4%) of 13 provinces, in the order: Tibet (23.0%), (13.6%), xinjiang, ningxia, shaanxi, Inner Mongolia (11.3%), (12.2%) (11.3%), guizhou (11.2%), shanxi (10.5%), (10.1%) in qinghai, gansu (8.8%) (9.2%), jiangxi, yunnan (8.1%), shandong (7.7%) and zhejiang (6.7%).
In May, China's total electricity consumption reached 496.8 billion KWH, up 5.1 percent year-on-year. The electricity consumption of the primary industry was 10.1 billion KWH, up 4.4% year on year. Electricity consumption in the secondary sector was 366bn KWH, up 3.9% from a year earlier. The tertiary industry consumed 62 billion kilowatt-hours of electricity, up 10.7% year on year. Electricity consumption for urban and rural residents reached 58.6 billion kilowatt-hours, up by 7.0 percent year-on-year.
By province, except Liaoning (-3.4%) and Fujian (-1.7%), all other provinces achieved positive growth in electricity consumption in May. Sixteen provinces saw electricity consumption grow faster than the national average (5.1%), with xizang (23.0%), Ningxia (13.9%) and Shaanxi (12.0%) growing by more than 10%.
2. The cumulative growth rate of industrial and manufacturing power consumption increased year-on-year, and the growth rate of electricity consumption fell for three consecutive months in the same month
From January to May, China's industrial electricity consumption reached 1,682.7 billion kilowatt-hours, up 6.3 percent year on year and 6.0 percentage points higher than that of the same period last year, accounting for 69.4 percent of the total electricity consumption and 69 percent of the total increase. Among them, light industry electricity consumption was 282.6 billion KWH, the same as
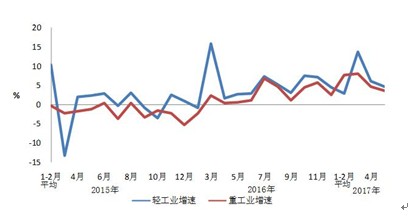 Figure 2: Power consumption growth of light and heavy industry by month since 2015
From January to May, China's manufacturing industry used 1,267.6 billion KWH of electricity, a year-on-year growth of 7.2% and 7.7 percentage points higher than that of the same period last year. In May, the country's manufacturing sector used 270.9 billion kilowatt-hours of electricity, up 3.3 percent year on year. Average daily electricity consumption in the manufacturing sector was 8.74 billion KWH/day, up 260 million KWH/day and down 320 million KWH/day respectively from the same period last year and last month.
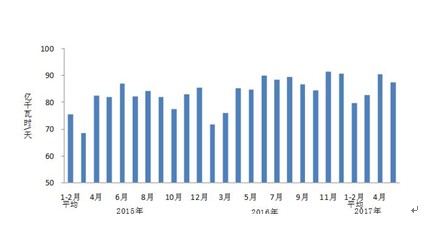 Figure 3: Average daily electricity consumption of manufacturing industry by month since 2015
三、The growth rate of electricity consumption in high-load energy industry increased year-on-year, and the electricity consumption of building materials and steel industry increased negatively in the same month
From January to May, the electricity consumption of the four high-load energy industries -- chemical raw material products, non-metallic mineral products, ferrous metal smelting and non-ferrous metal smelting -- totaled 721.6 billion KWH, up 6.9 percent year on year and 10.5 percentage points higher than that of the same period last year. The total electricity consumption accounted for 29.7% of the total electricity consumption of the whole society, and the contribution rate to the growth of the whole society was 32.0%. Electricity consumption in the chemical industry was 179.5 billion KWH, up 3.3% year on year and down 1.1 percentage points from the same period last year. Electricity consumption in the building materials industry was 119.1 billion KWH, up 3.3% year-on-year and 4.8 percentage points higher than that in the same period of last year. Electricity consumption of ferrous metal smelting industry reached 1952 billion KWH, up 4.2% and 14.4% year-on-year. The non-ferrous metal smelting industry reached 227.9 billion KWH, up 14.5% year on year and 19.5 percentage points higher than the same period of last year.
In May, the electricity consumption of the four high-load energy industries totaled 152 billion kilowatt-hours, up 1.1 percent year on year and 2.0 percentage points higher than that of the same period last year, accounting for 30.6 percent of the total. Among them, electricity consumption in the chemical industry reached 36.4 billion kilowatt-hours, up 1.2% year on year and down 4.5 percentage points from the same period last year. Electricity consumption of the building materials industry was 29.3 billion KWH, down 0.7% year on year, and the growth rate was 1.5 percentage points lower than that of the same period last year. The electricity consumption of ferrous metal industry was 38.5 billion KWH, down 8.2% year on year and 3.4 percentage points lower than that of the same period last year. The smelting industry of non-ferrous metals reached 47.7 billion KWH, up 11.3% year on year and 14.8 percentage points higher than the same period of last year.
Figure 4: Electricity consumption of key industries by month since 2015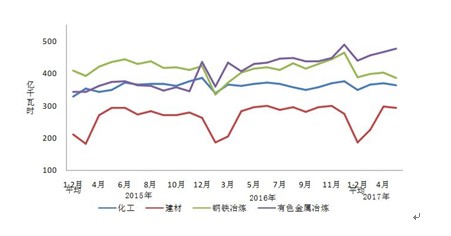
4. The growth rate of installed power generation capacity slowed down, and hydropower generation continued to show negative growth year-on-year
By the end of May, the installed capacity of power plants with 6,000 kw or above was 1.62 billion KW, up 7.3 percent year on year and 4.2 percentage points lower than that of the same period last year. Hydropower is 290 million kw, thermal power 1.06 billion kw, nuclear power 34.73 million kW, and grid-connected wind power 150 million KW. In the first five months of this year, power generation from large-scale power plants reached 2,346.8 billion KWH, up 6.4 percent year-on-year and 5.5 percentage points higher than that of the same period last year.
From January to May, hydropower generated 357 billion kilowatt-hours from power plants above designated size, down 4.8 percent year on year and down 21.5 percentage points from the same period last year. Sichuan (92 billion KWH), Yunnan (72.4 billion KWH) and Hubei (47.1 billion KWH) were the top three provinces in hydropower generation. Their combined hydropower generation accounted for 59.3% of China's hydropower generation, with year-on-year increases of 7.4%, 22.8% and -5.8%, respectively.
From January to May, the country's thermal power generation capacity of large-scale power plants reached 1,849.7 billion KWH, up 7.2% and 10.8% year-on-year. Provinces, in addition to hainan national (12.3%), Beijing (7.4%), yunnan (4.6%) and Shanghai (1.7%) and liaoning (1.2%) thermal power generating capacity of negative growth, other provinces thermal power generating capacity to achieve positive growth, among them, the growth rate of more than 20% (29.8%) of hunan province, qinghai (27.6%), (26.4%) in guangxi, ningxia (24.2%) and jiangxi (21.3%), growth of more than 10% (18.0%) in guizhou province (15.1%), guangdong (17.0%), Tibet and fujian (14.1%).
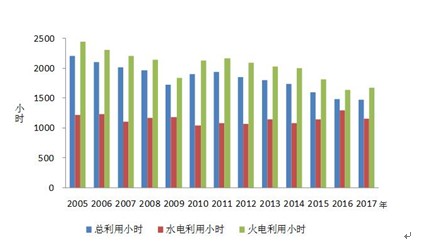 Figure 5: Utilization of hours from January to May in each year since 2005
From January to May, the average utilization hours of hydropower equipment in China were 1,161 hours, 134 hours lower than that of the previous year. Among the seven provinces with installed hydropower capacity of over 10 million kw, the average utilization hours of hydropower equipment in all the provinces, except Yunnan, decreased by more than 300 hours, including Guizhou, Guangxi and Hunan, by 605, 534 and 388 hours, respectively. The average utilization hours of thermal power equipment in China were 1,677 hours, an increase of 42 hours over the previous year. The number of hours spent on thermal power equipment in Jiangsu, Hebei and Shandong exceeds the national average. The number of hours spent on thermal power equipment in Yunnan and Xizang is 543 and 54, respectively. Compared with the same period last year, the number of hours of thermal power utilization increased in 20 provinces, including Hunan and Jiangxi by more than 200 hours and Fujian, Guangdong, Shaanxi, Qinghai, Zhejiang, Ningxia and Guizhou by more than 100 hours. Hainan, Beijing and Chongqing have lost more than 100 hours, 239, 132 and 105 hours respectively. The average utilization hours of nuclear power facilities in China were 2,816 hours, an increase of 62 hours year-on-year. The average utilization hours of wind power equipment in China are 852 hours, an increase of 59 hours over the previous year.
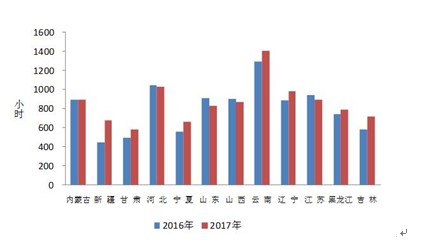
Figure 6: Utilization hours of wind power equipment in provinces with more installed wind power from January to May
6. Year-on-year growth of electricity delivered across regions and provinces
From January to May, 130.6 billion kilowatt-hours of electricity were delivered across regions, up 9.7% year on year. Of this, 2.3 billion KWH from North And Central China (UHV) decreased by 27.7% year-on-year; North China sent 6.3 billion KWH to East China, down 3.0% year-on-year; Northeast China sent 8.9 billion KWH to North China, up 19.0% year on year. Central China sent 8.6 billion KWH to East China, down 19.4% year-on-year; Central China sent 8.1 billion KWH to the south, down 4.0% year-on-year; Northwest China sent 39.9 billion KWH to North and Central China, up 10.0% year on year. Southwest China sent 24 billion KWH to east China, up 2.7 percent year on year.
In the first five months of this year, 384.3 billion kilowatt-hours of electricity were sent by provinces, up 8.6 percent year-on-year. Inner Mongolia sent 58.9 billion kilowatt-hours of electricity, up 9.1 percent year on year. Yunnan sent 44.3 billion kilowatt-hours of electricity, up 37.5 percent year on year. Shanxi sent 31.6 billion kilowatt-hours of electricity, up 10.6% year on year. Sichuan sent 30.8 billion kilowatt-hours of electricity, up 5.0% year on year. Hubei sent 25 billion kilowatt-hours of electricity, down 7.9% year on year. Anhui sent 21.6 billion kilowatt-hours of electricity, down 0.2% from a year earlier. Guizhou sent 20 billion kilowatt-hours of electricity, down 32.8 percent year-on-year. Ningxia sent 19 billion kilowatt-hours of electricity, up 47.6% year on year. Xinjiang sent 18.9 billion kilowatt-hours of electricity, up 28.4 percent year on year. Hebei sent 18.4 billion kilowatt-hours of electricity, up 4.1 percent year on year. Shaanxi sent 16 billion kilowatt-hours of electricity, up 21.1 percent year on year.
In May, 29.8 billion KWH of electricity was delivered across regions, up 14.1 percent year on year. North China sent 1.4 billion kilowatt-hours to east China, up 25.6% year on year. Northeast China sent 1.7 billion kilowatt-hours to North China, up 626.2 percent year-on-year
